
The team at Ride Report has been busy and we’re excited to share some of our newest updates and features, and how these updates will positively impact cities. We are constantly evolving our micromobility data management solutions to meet the ever-changing needs of city micromobility program. Each update has been thoughtfully developed in order to bring maximum utility and efficiency to our city customers.
Our recent updates make our dashboard more useful than ever. It’s now possible to:
- Manage fees and invoice operators
- Track even more vehicle statistics
- Understand the reason for vehicle trip starts and ends
- View our data feed incident log (and how we’re resolving those incidents!)
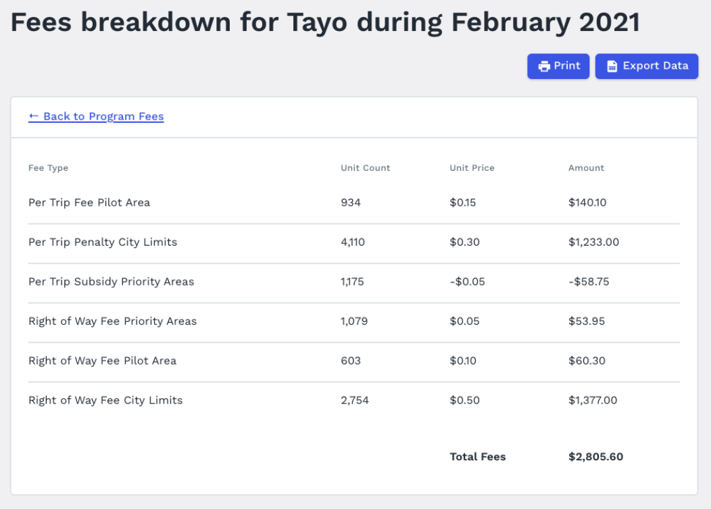
To lessen the administrative burden of shared micromobility, Ride Report’s fees feature allows cities to set and track fees based on defined metrics such as deployed vehicles, trips starting in specific zones, or trips taken systemwide. Users can create invoices for their operator partners all within the dashboard.
With this functionality, customers like PBOT save hours per month per operator in the invoicing process, freeing up staff time and resources to focus on other relevant revenue-generating initiatives. Effectively managing micromobility fees is crucial to the long-term success of a program. Ride Report recognizes the importance of fee management, and built our fees feature with all the functionality needed for cities to maintain a fee structure that ensures program sustainability.
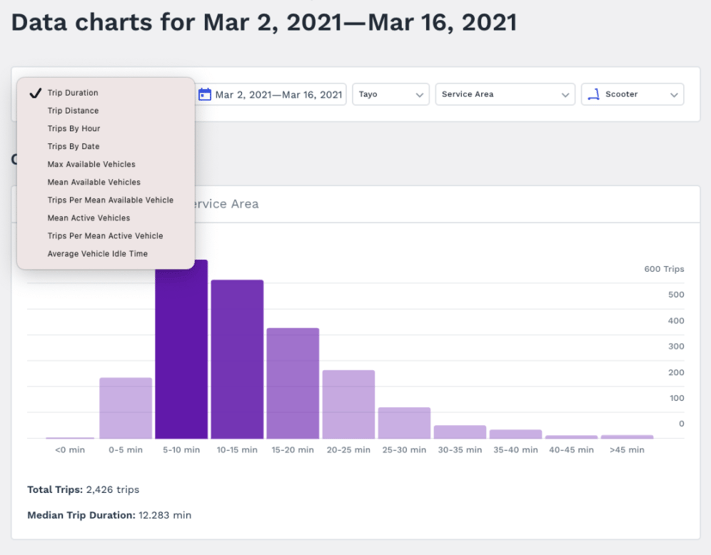
Our city clients have been asking for additional insights, and we were happy to oblige! There are now even more metrics available through the Analyze tab:
- Mean available vehicles
- Trips per available vehicle
- Mean active vehicles
- Trips per active vehicle
- Mean vehicle idle time
Understanding vehicle availability
Users of the Ride Report dashboard can now filter trip starts and ends by status reason. This update allows cities to understand why specific vehicles are available or unavailable at any given time. Possible explanations include agency drop off, maintenance drop off, rebalance drop off, service start, user drop off, low battery, or maintenance.
What’s useful about these new metrics? "Planning staff can have a deeper understanding of specific land uses that generate micromobility trip starts or attract trip ends. This can inform efforts to use micromobility in targeted ways to replace vehicle trips. The feature also provides the ability to filter by status reason, so users can look at where operators tend to rebalance their vehicles or deploy them most frequently separate from where users start or end their trips."
— Michael Schwartz, Head of Customers and Policy
Transparency of mobility data management
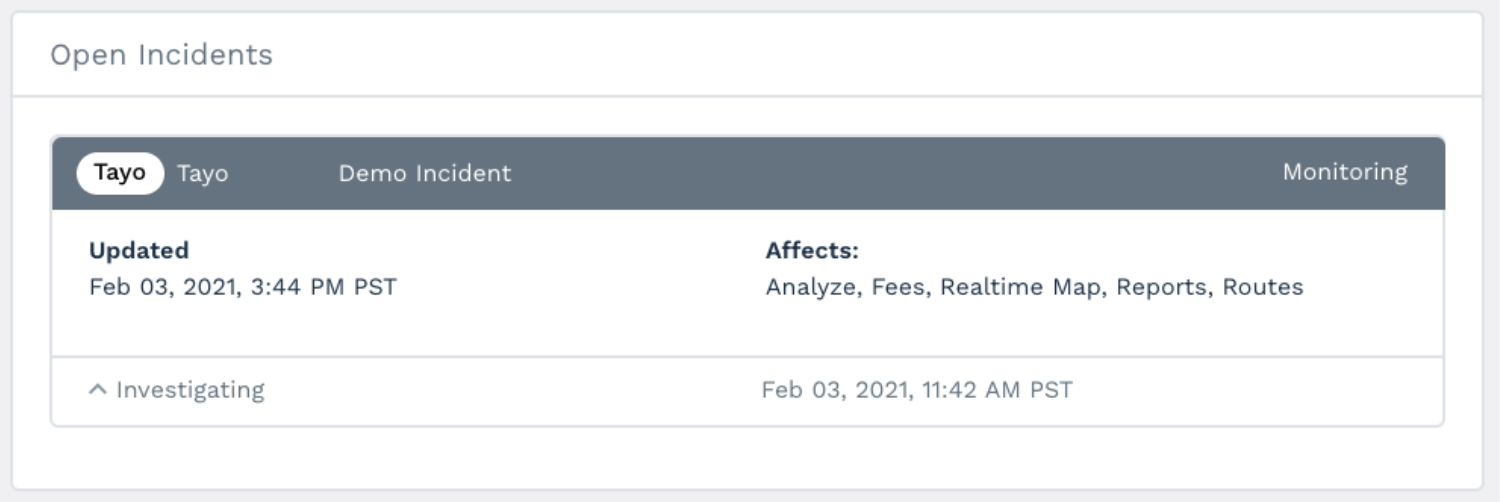
Open Incidents report (the numbers shown do not reflect actual city data)
Data trustworthiness is at the core of all that we do at Ride Report. To provide our customers with even more transparency to their micromobility data, Ride Report has developed the Incident Reports feature. Incident Reports allow our customers to view all open and past issues within their MDS feeds, including the components an issue is affecting, the operator and feeds impacted, and the status of the issue being resolved. For further transparency, Ride Report provides documentation of the steps taken on our end to resolve each data issue.
Our vision is to have the most trustworthy mobility data in the world. From generating compliance metrics to creating trip invoices, the data we ingest from mobility operators needs to be accurate, complete, and timely. As Ride Report users, you should never have to wonder if the data you are seeing is correct. Ride Report is excited to continue to make significant investments in data trustworthiness.
— Michal Naka, Head of Operator Product
Evolving with the industry
Micromobility and cities will continue to change as new factors are thrown into the mix, and Ride Report is equipped and ready to make the updates to stay ahead of these changes. We’ve positioned ourselves to be able to react quickly to change and are open to evolving our solution based on customer feedback, market changes, and potential to accelerate positive outcomes for cities and partners.
Interested in learning more about these new features and how Ride Report can help launch and optimize your city’s micromobility program?