Frame 100-2

RideshedTM is finally here!
IMPACTS

Measure and share the multi-modal outcomes of new infrastructure, events, and policies, effortlessly, perpetually. You set the parameters. Impacts provides the ongoing data collection, analysis, and visualization. 

RR_rideshedBLAKE
Use Rideshed™

The Rideshed™ feature shows routes taken on shared bike and scooter trips that travel to, from, or through your project area. Click on road segments to see how the new project expanded access and improved connectivity.

Preview in Denver

Explore the impacts of the city's first neighborhood greenway, the doubling of their shared bike and scooter program, and five protected bike lanes! 

map_deenver_TMP-1

Impacts projects at a glance

Project Name
City / Installation Date
 Preview
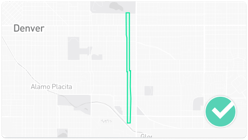
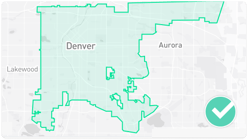
Garfield Neighborhood Greenway
Denver

Oct 1, 2022
Garfield
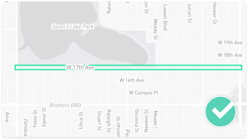
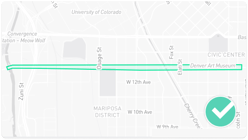
17th Ave Transit + Bike Improvements
Denver

Nov 20, 2021
17th
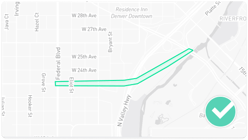
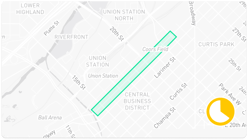
23rd -> Water Protected Bike Lane
Denver

May 21, 2022
23rd
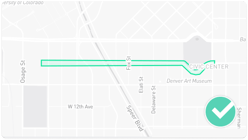
14th Ave Improvements
Denver

Jan 1, 2020
14th
DOTI Shared Micromobility Expansion
Denver

May 15, 2021
DOTI
13th Ave Protected Bike Lane
Denver

Jan 1, 2021
13th
Blake Street Improvements
Denver

May 5, 2023
Blake


Multimodal Data Pilot

Ride Report’s Impacts incorporates relevant datasets to measure multimodal outcomes of projects and policies against public agency goals. For this pilot, we leveraged Streetlight InSight® which uses Connected Vehicle Data, the Internet of Things, and other data sources to provide multimodal mobility insights. Since 2011, Streetlight has harnessed hundreds of sources to generate on-demand information to empower transportation decisions.

SL_cooop
Screenshot of Streetlight data integration

   Screenshot of computed metrics based of Streetlight Data

Bring Impacts to your projects