Our solutions for cities
Ride Report’s suite of tools consists of seven tabs that meet cities’ range of needs for shared mobility data management. From reporting to invoicing, we have you covered.
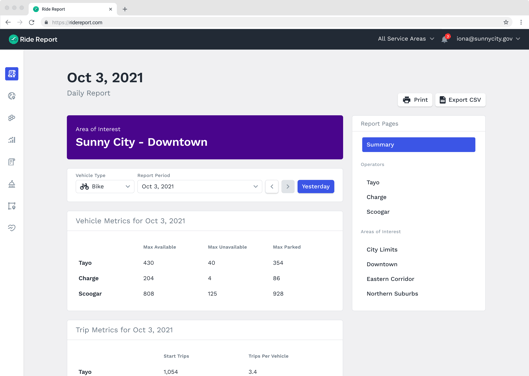
Reports
Our reports are flexible, allowing cities to understand vehicle, trip, and deployment metrics at the day, week, month, or custom date range level. We support geofenced areas, with unlimited custom Areas of Interest (“AOIs”), or zones. Information is downloadable to .csv and ArcGIS compatible GeoJSON. City personnel can also set up email reports to be delivered daily to see top level benchmark reporting without needing to login to the dashboard.
Tell The Reader More
Ride Report’s suite of tools consists of seven tabs that meet cities’ range of needs for shared mobility data management. From reporting to invoicing, we have you covered.
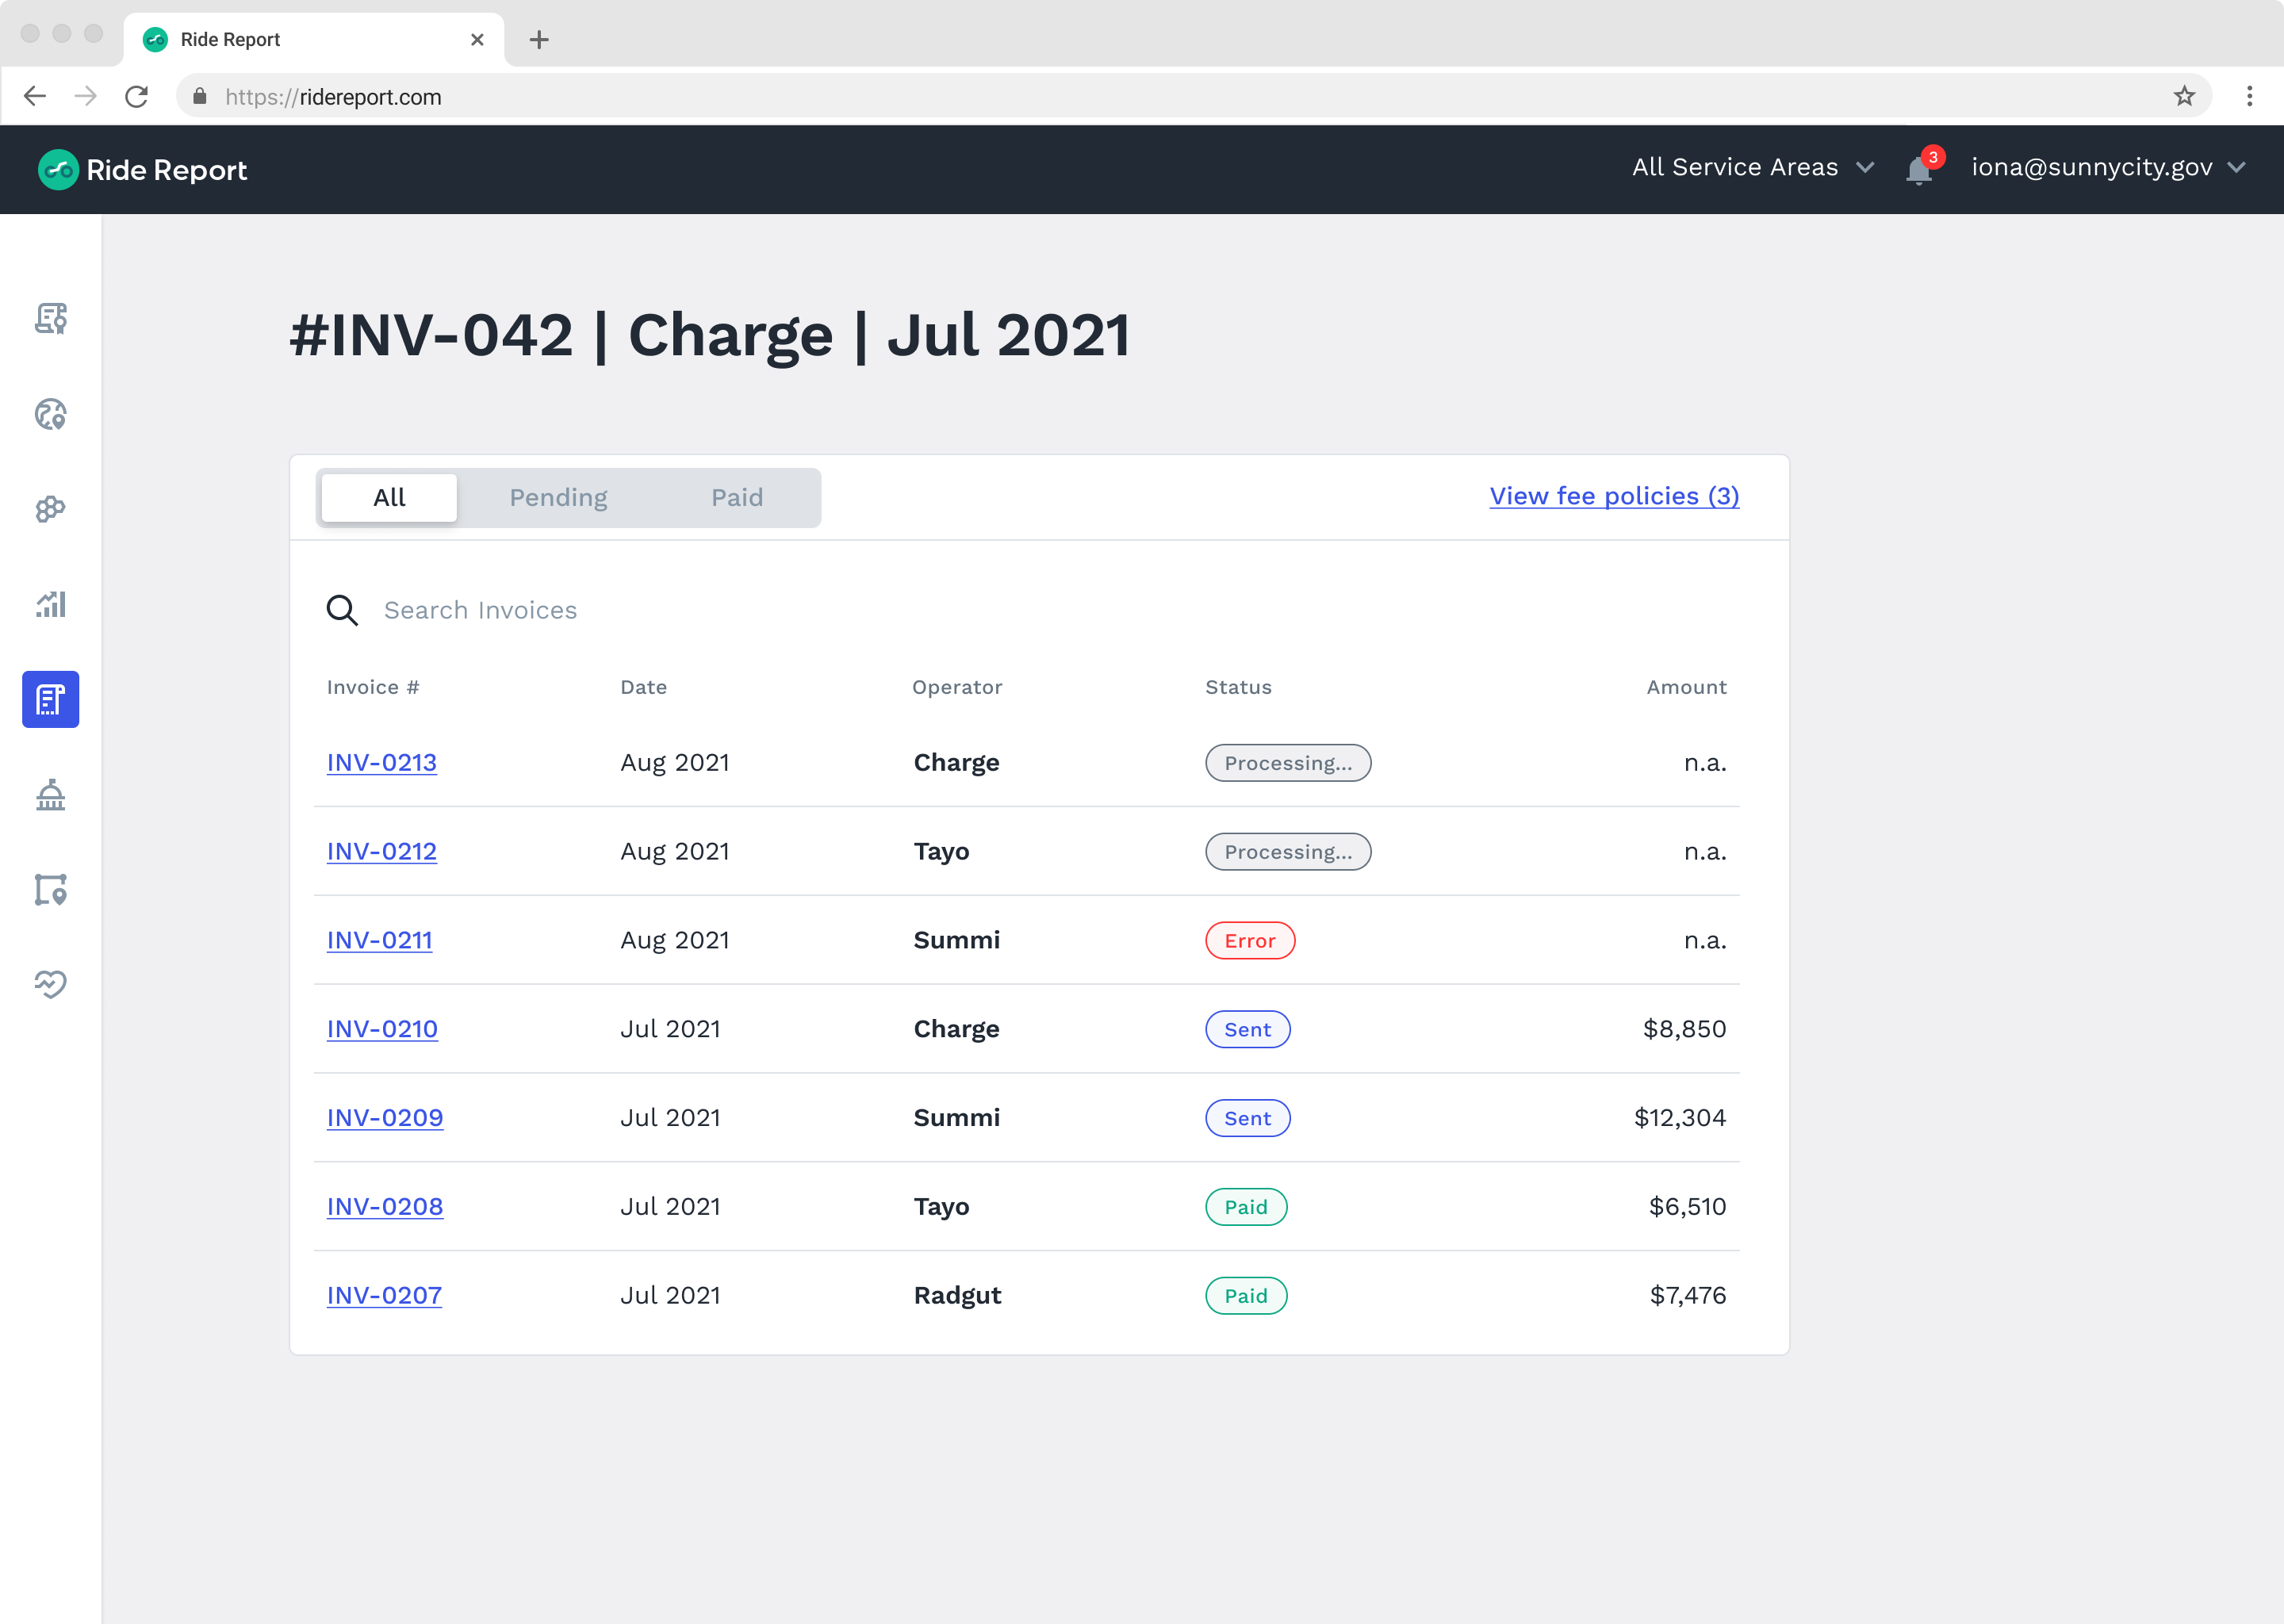
Fees
Ride Report’s industry-leading fees feature allows cities to set and track fees, subsidies, and penalties and create invoices for their operator partners, all within the dashboard. Our system not only allows the city to download an invoice for their operator partners, but also includes a digital paper trail of all trips occurring in case any questions arise related to the fees owed.
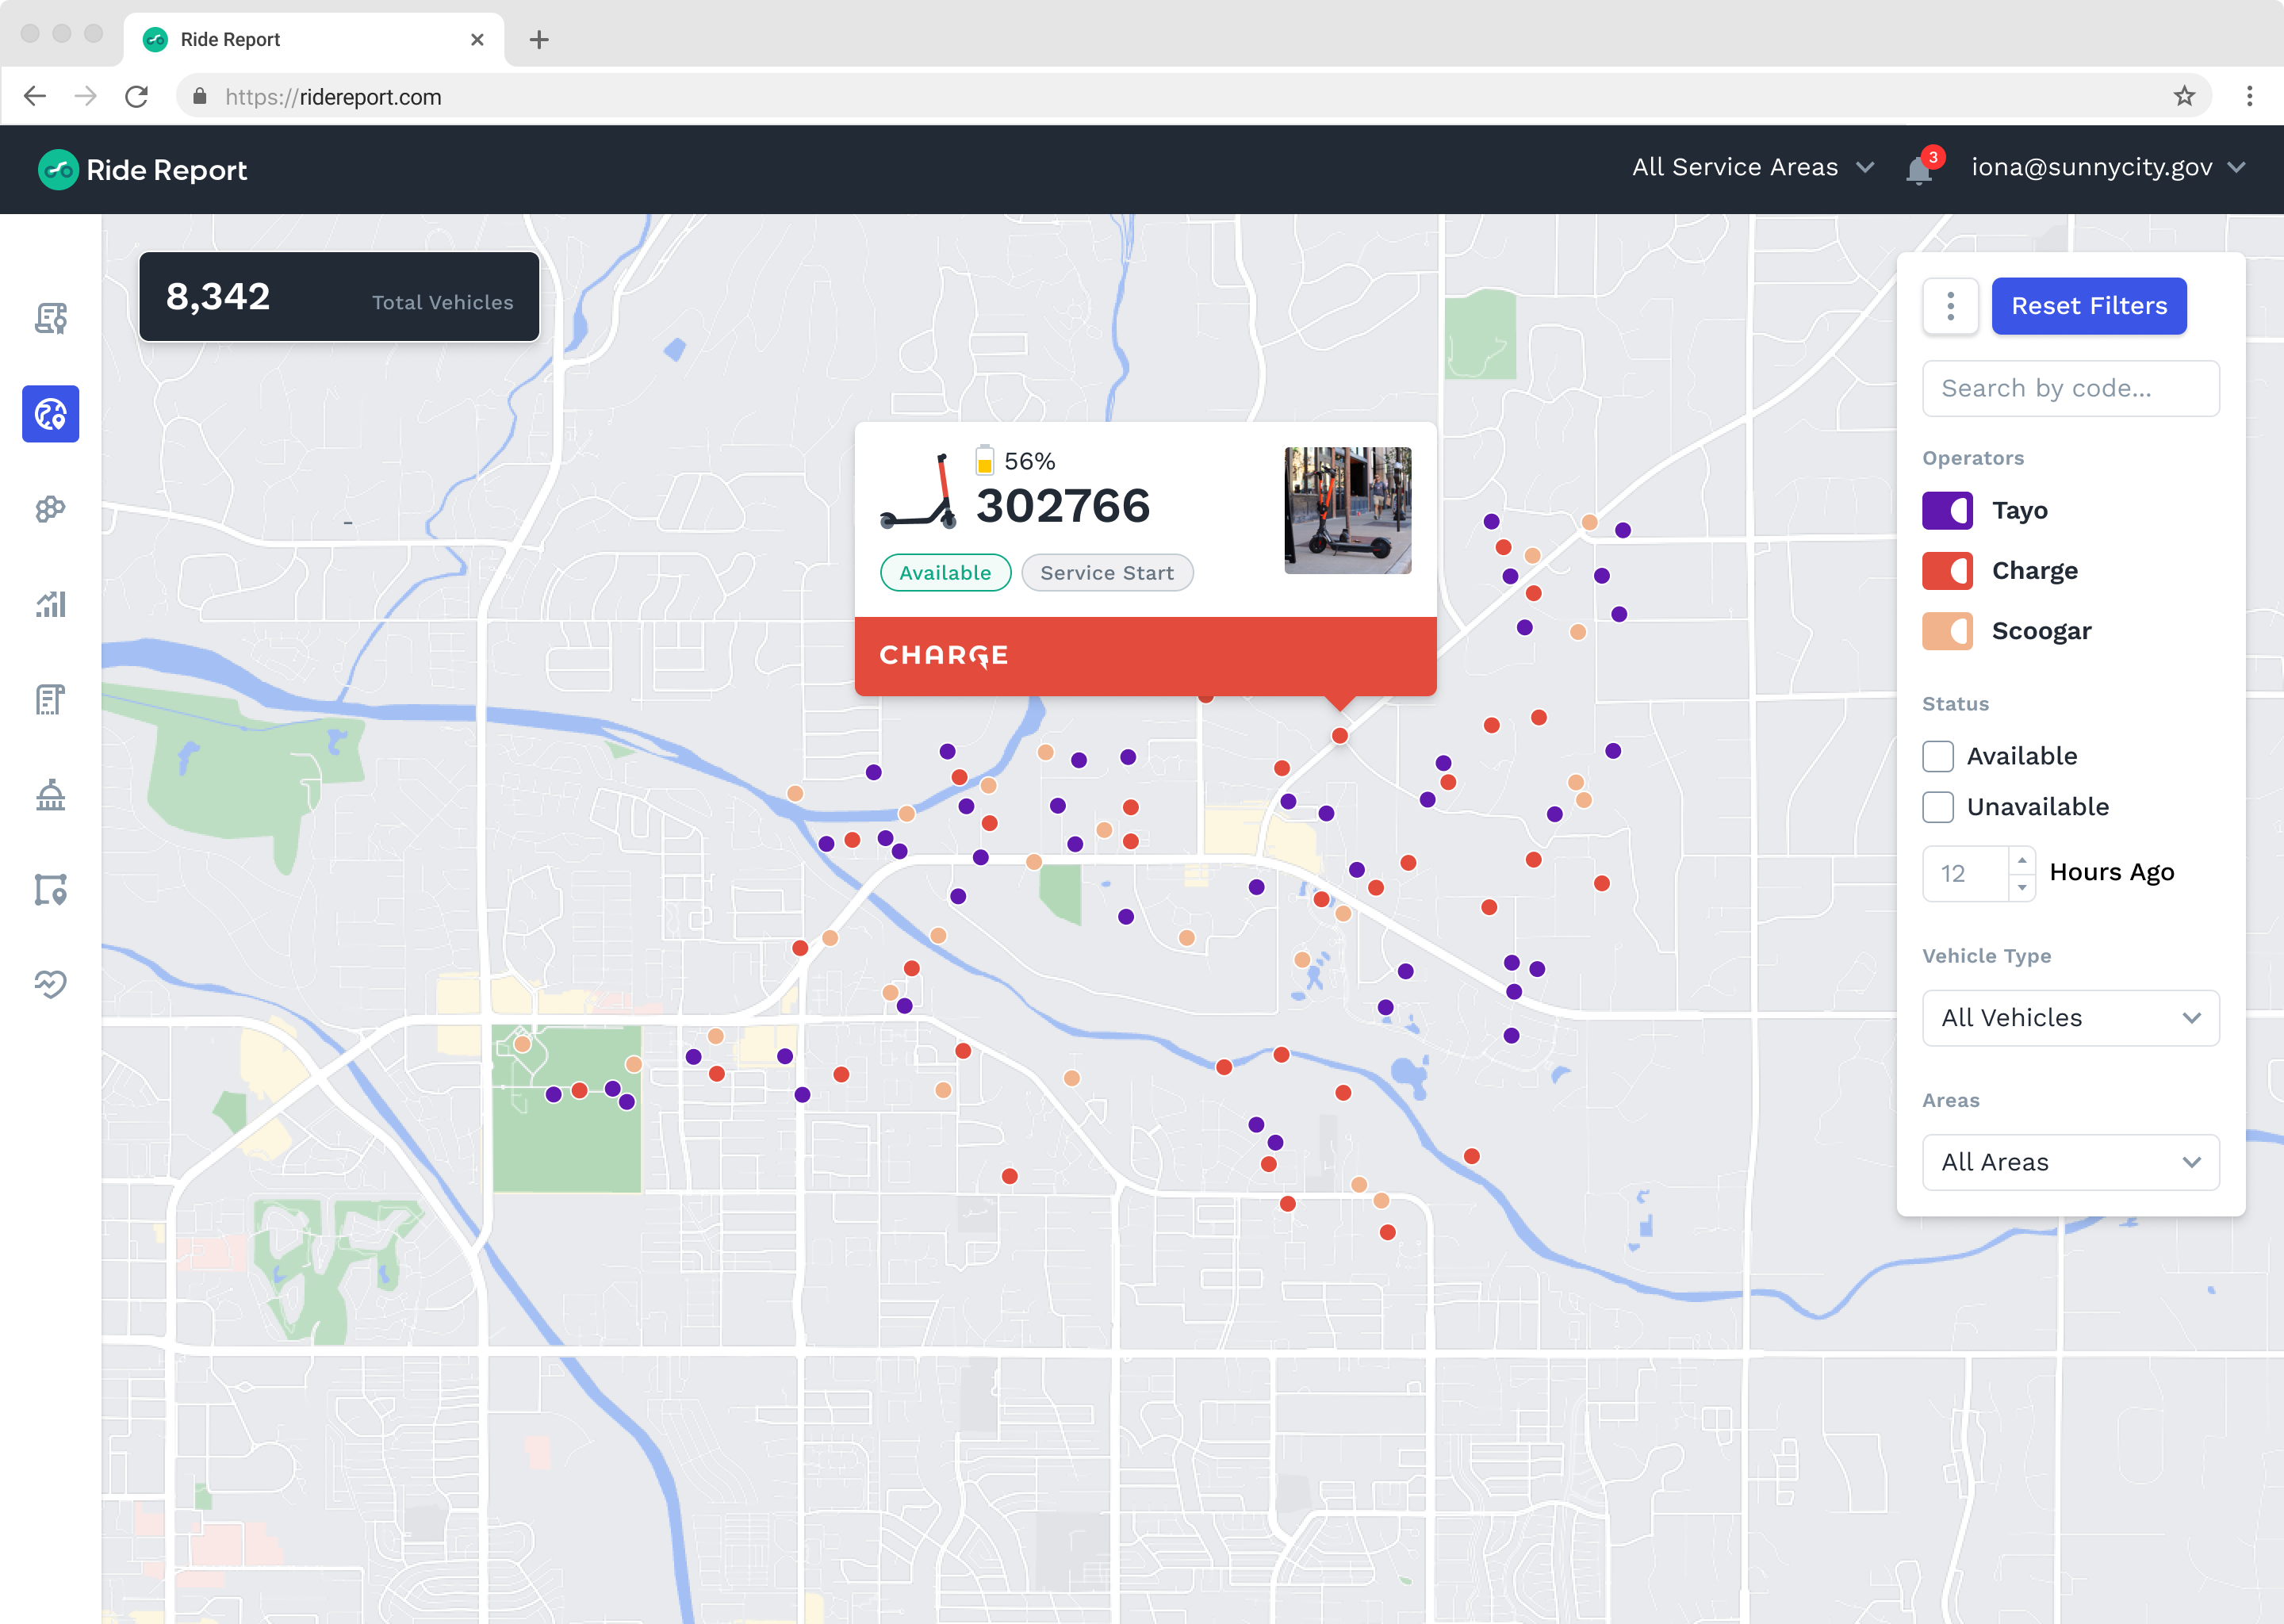
Realtime
Ride Report surfaces live locations for all shared mobility vehicles in a given geography. This relies on MDS status data, and shows each vehicle’s real-time status, location, state of charge, time elapsed since the last status change, last parked image (if provided by the operator), and unique vehicle ID. This data can also be filtered by operator, available/unavailable, status reason, time on the right of way without a status change, and area of interest.
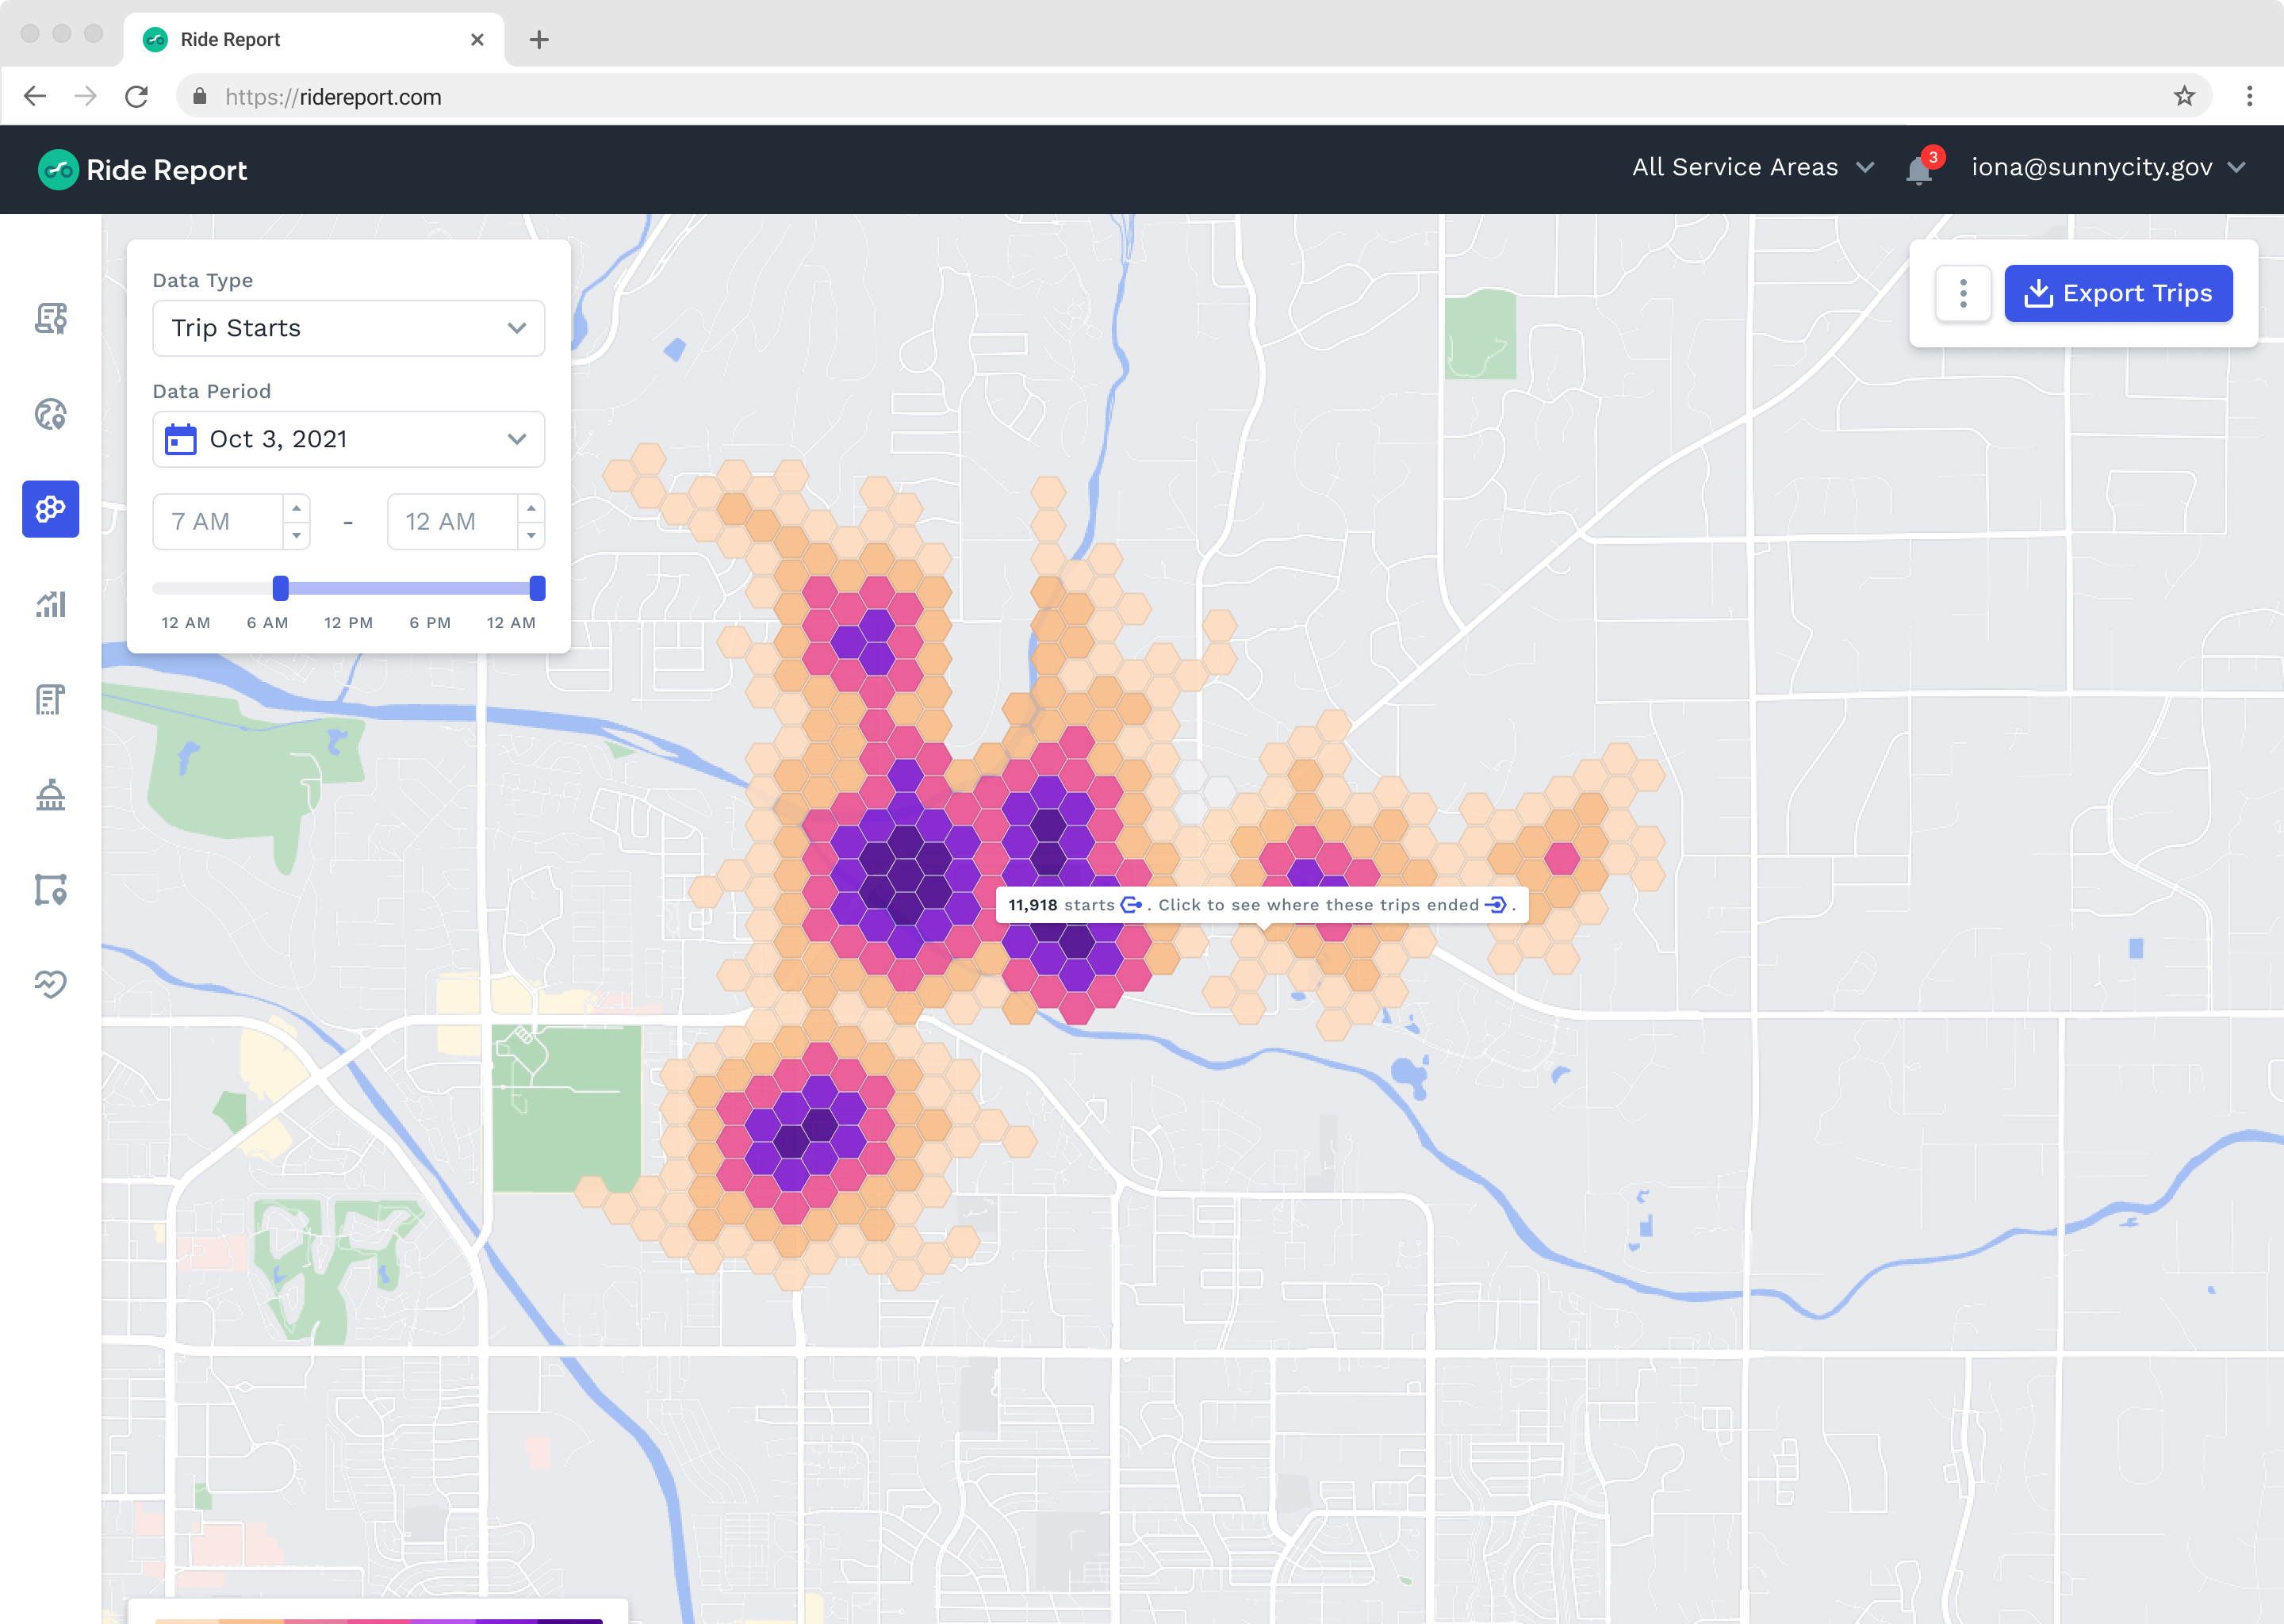
Heatmaps
Ride Report displays aggregated trip data in the form of trip starts and ends, as well as routes to evaluate new and existing infrastructure performance, ridership trends, and details about specific street segments. These features can be filtered by date period as well as time(s) of the day, and have bike lanes and multi-use paths layered onto the tool, all with the ability to export data to a .csv, GeoJson, or ArcGIS.
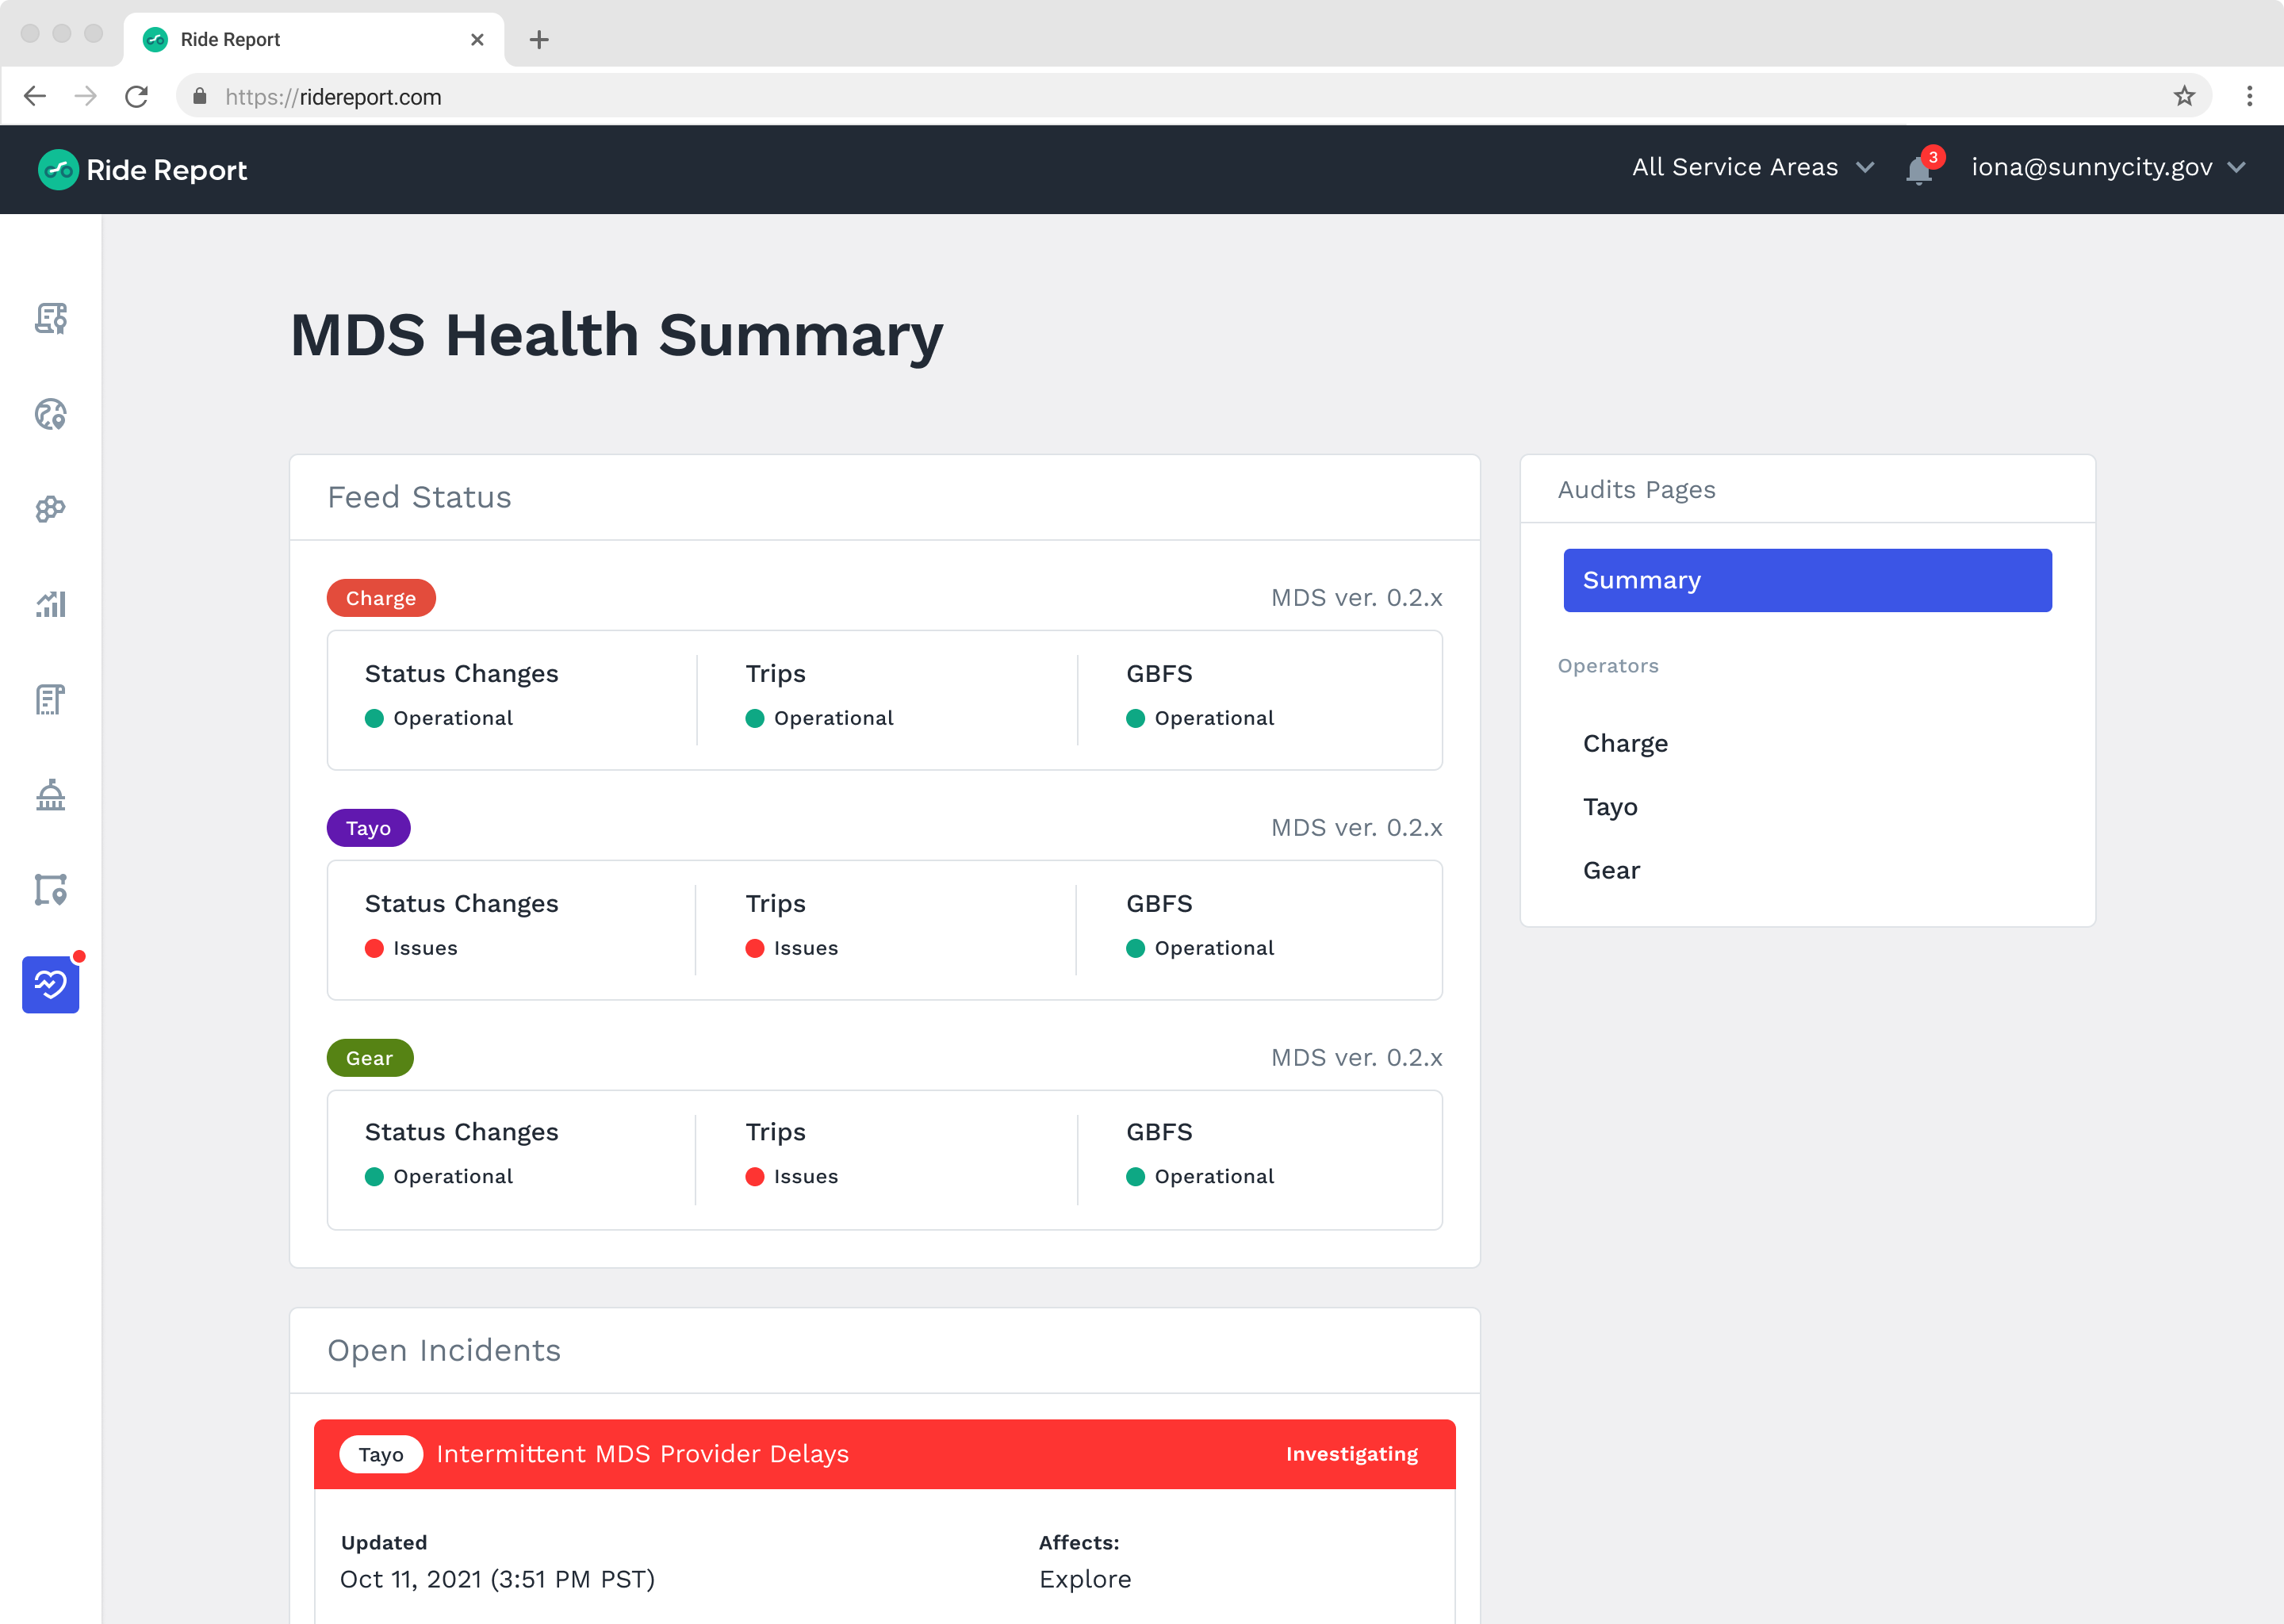
Health
Ride Report dedicates a team to data trustworthiness, ensuring that the numbers and charts in the dashboard are wholly reflective of the truth on the ground. This work is visible in our industry-leading MDS Health feature that gives insight into the reliability of each operator’s data feed at any given moment.
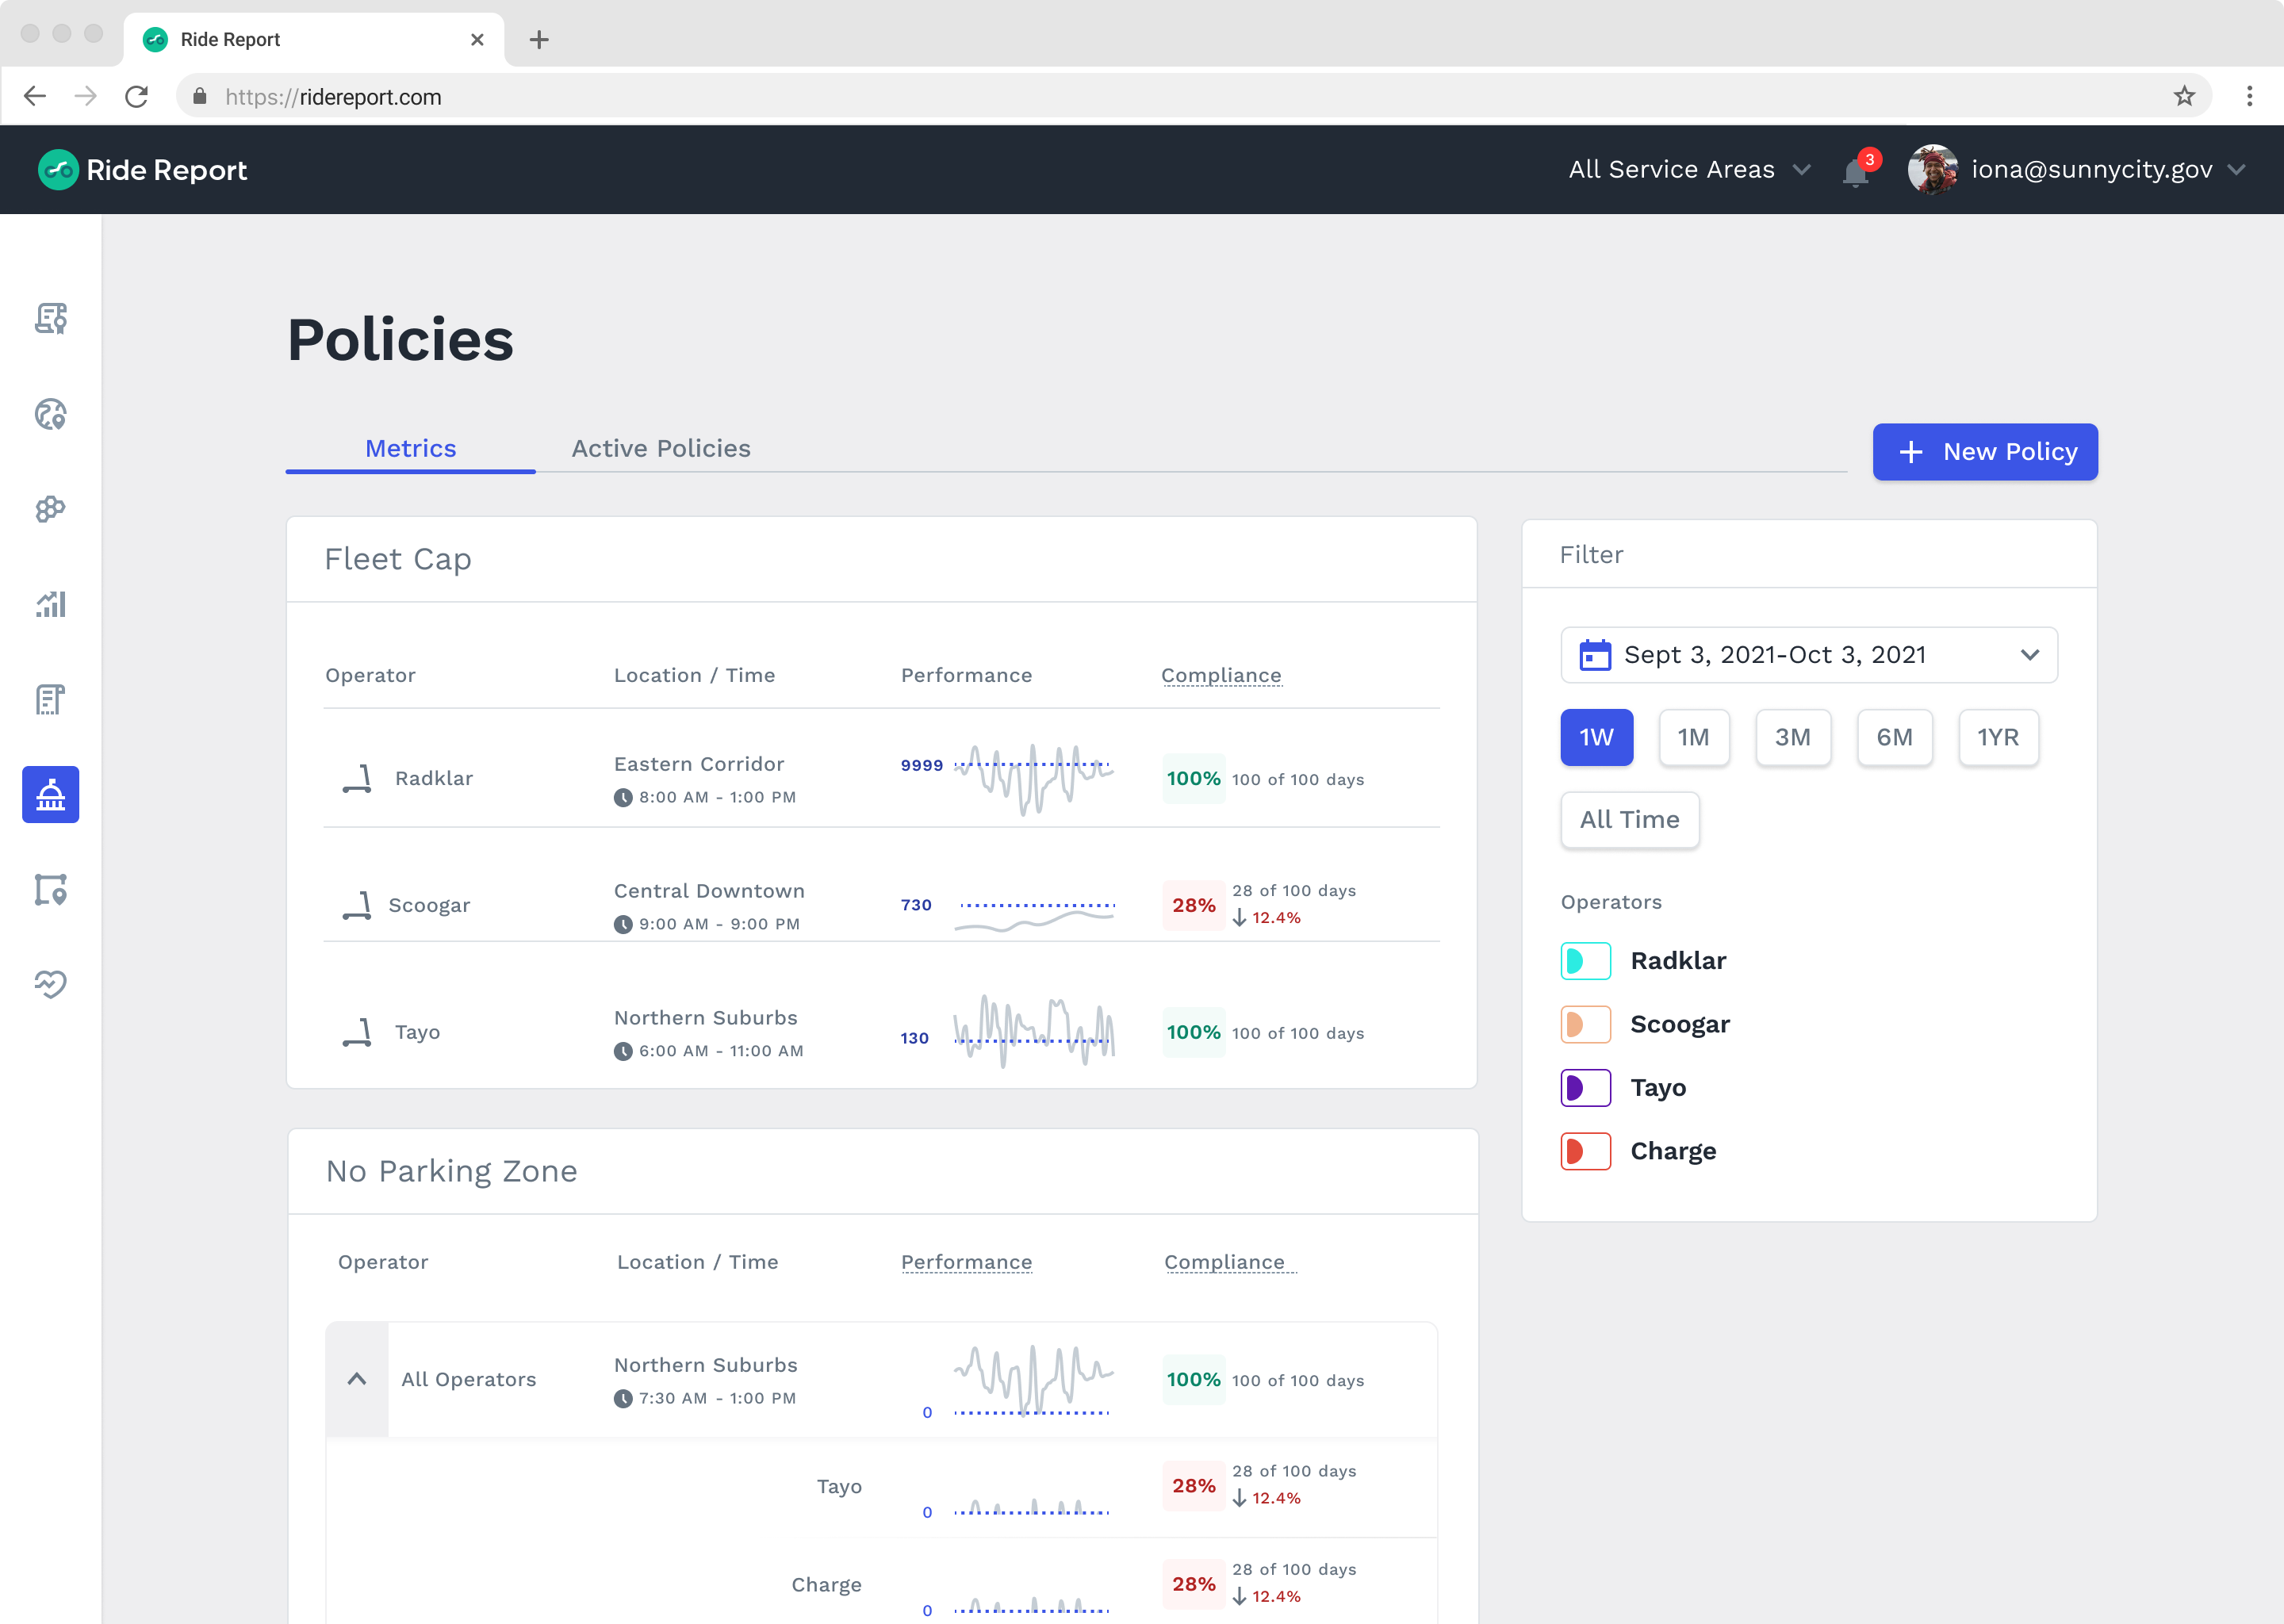
Policy
Ride Report’s Policy feature enables cities to set their policies and rules in Ride Report, and understand how operators are, or are not, abiding by the rules and regulations. These policies are communicated out to the operators via the Operator Dashboard, ensuring a seamless delivery, and monitoring, of the city’s rules.
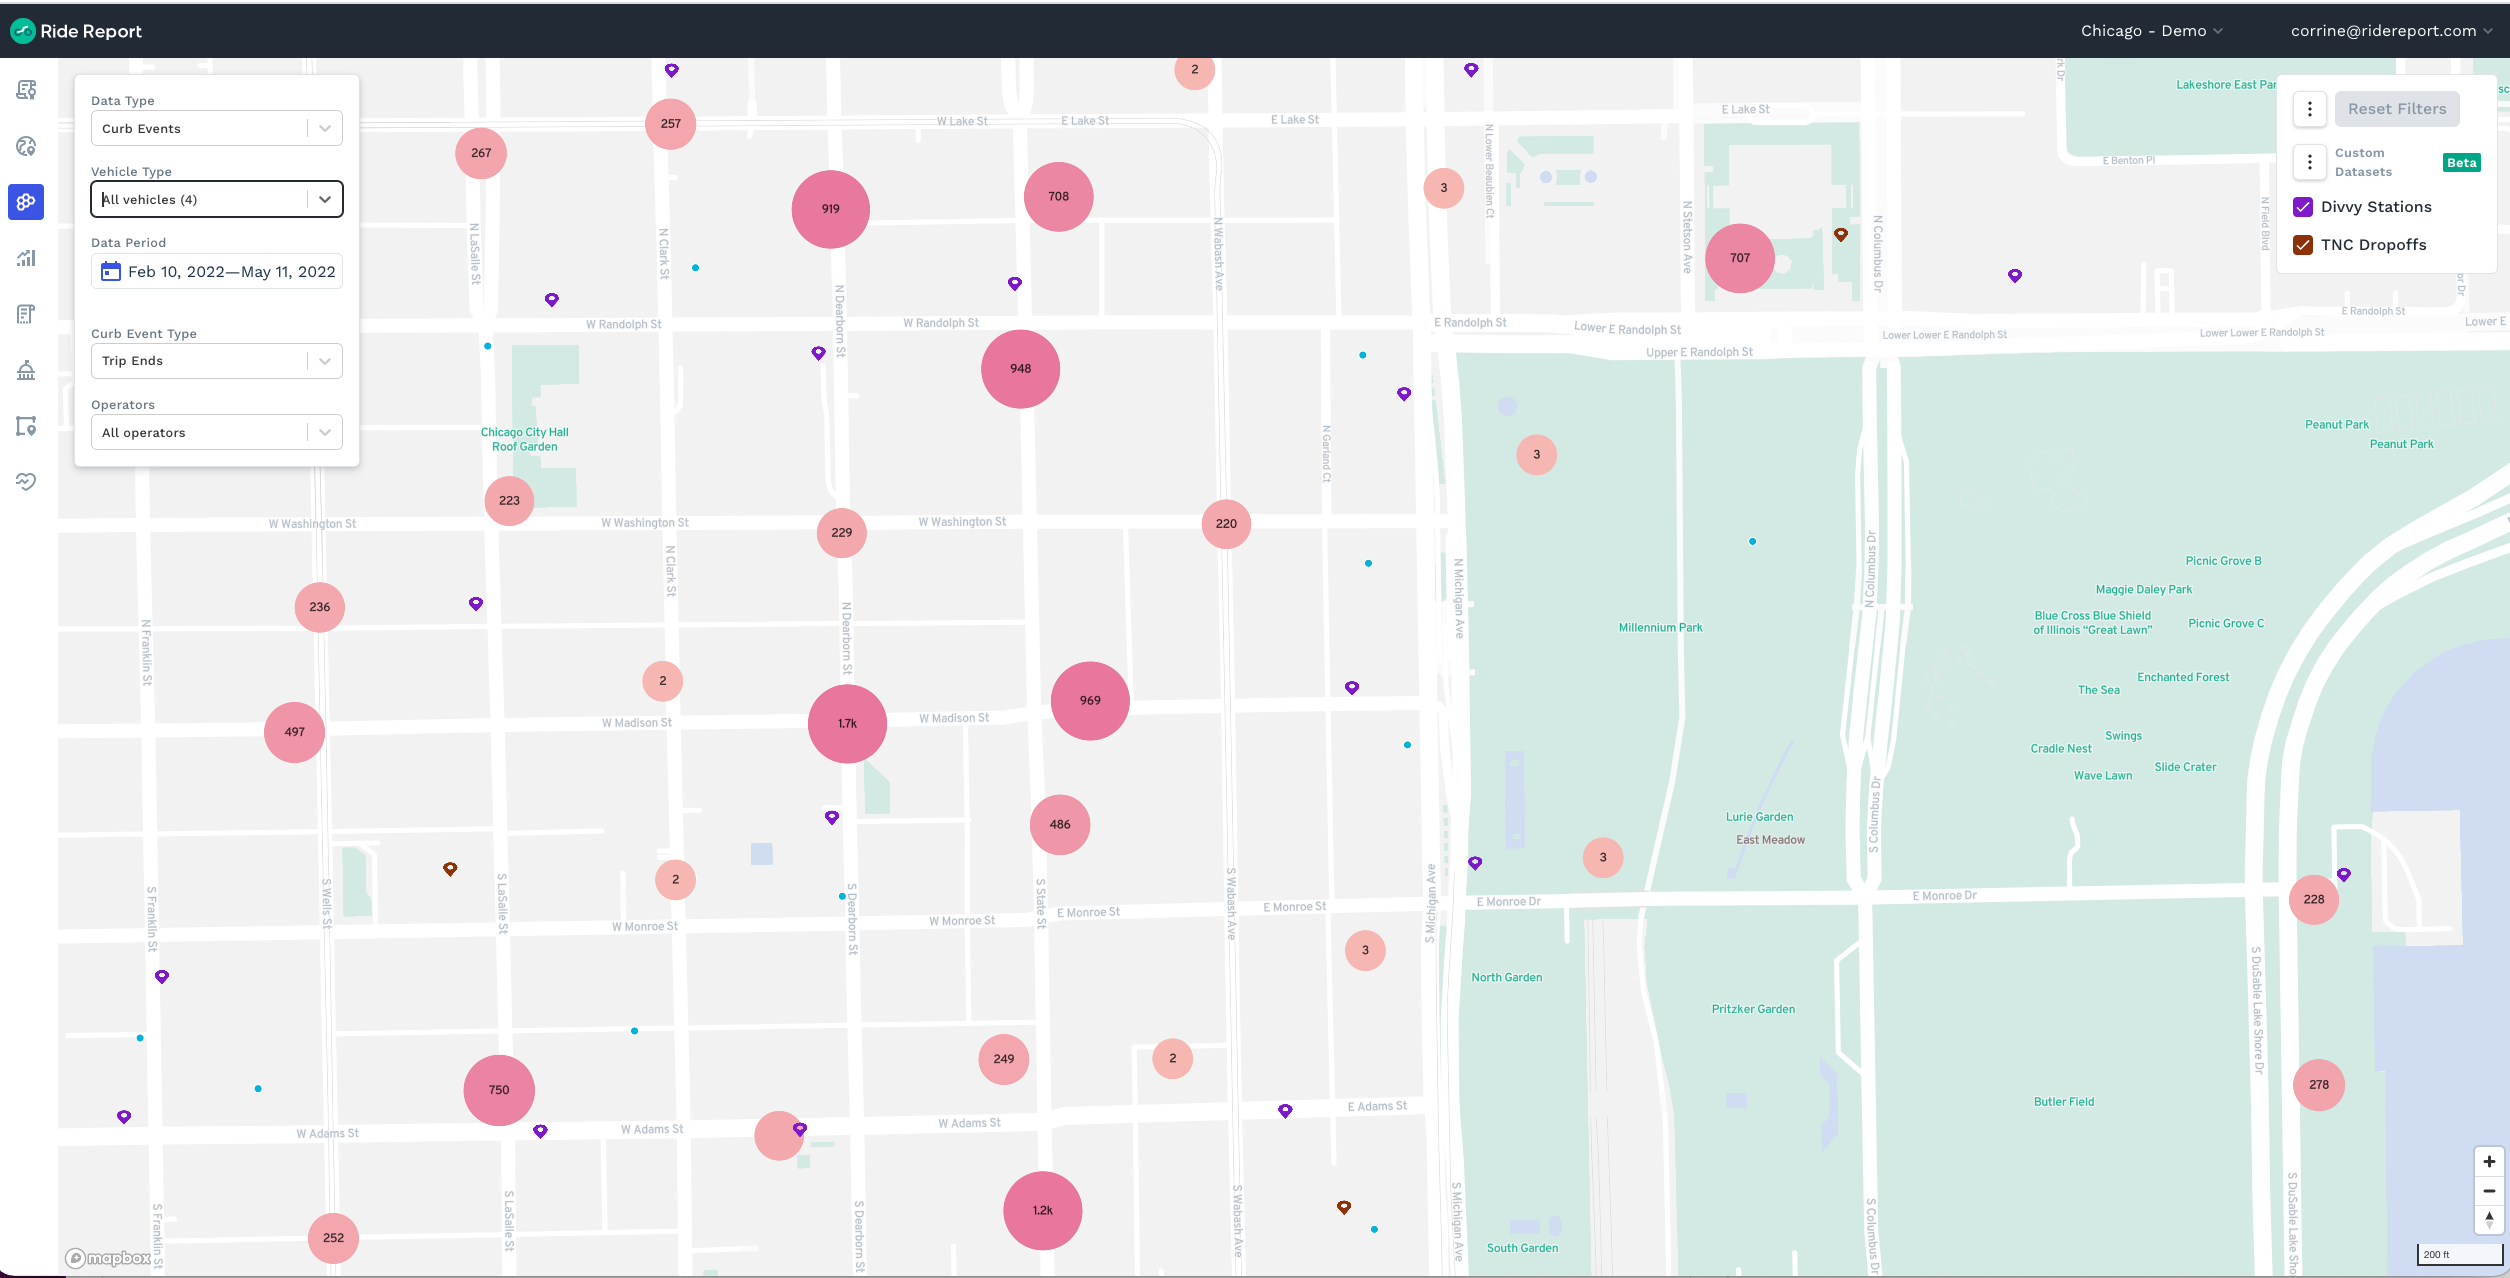
Curb Events
Ride Report’s Curb Events solution enables users to see precisely where trips originate and terminate at the block and sub-block level, along with operator deployment locations. Zoom in to see exceedingly precise trip start, end, and deployment locations by vehicle type. This functionality can be used to assess ideal locations for future infrastructure.
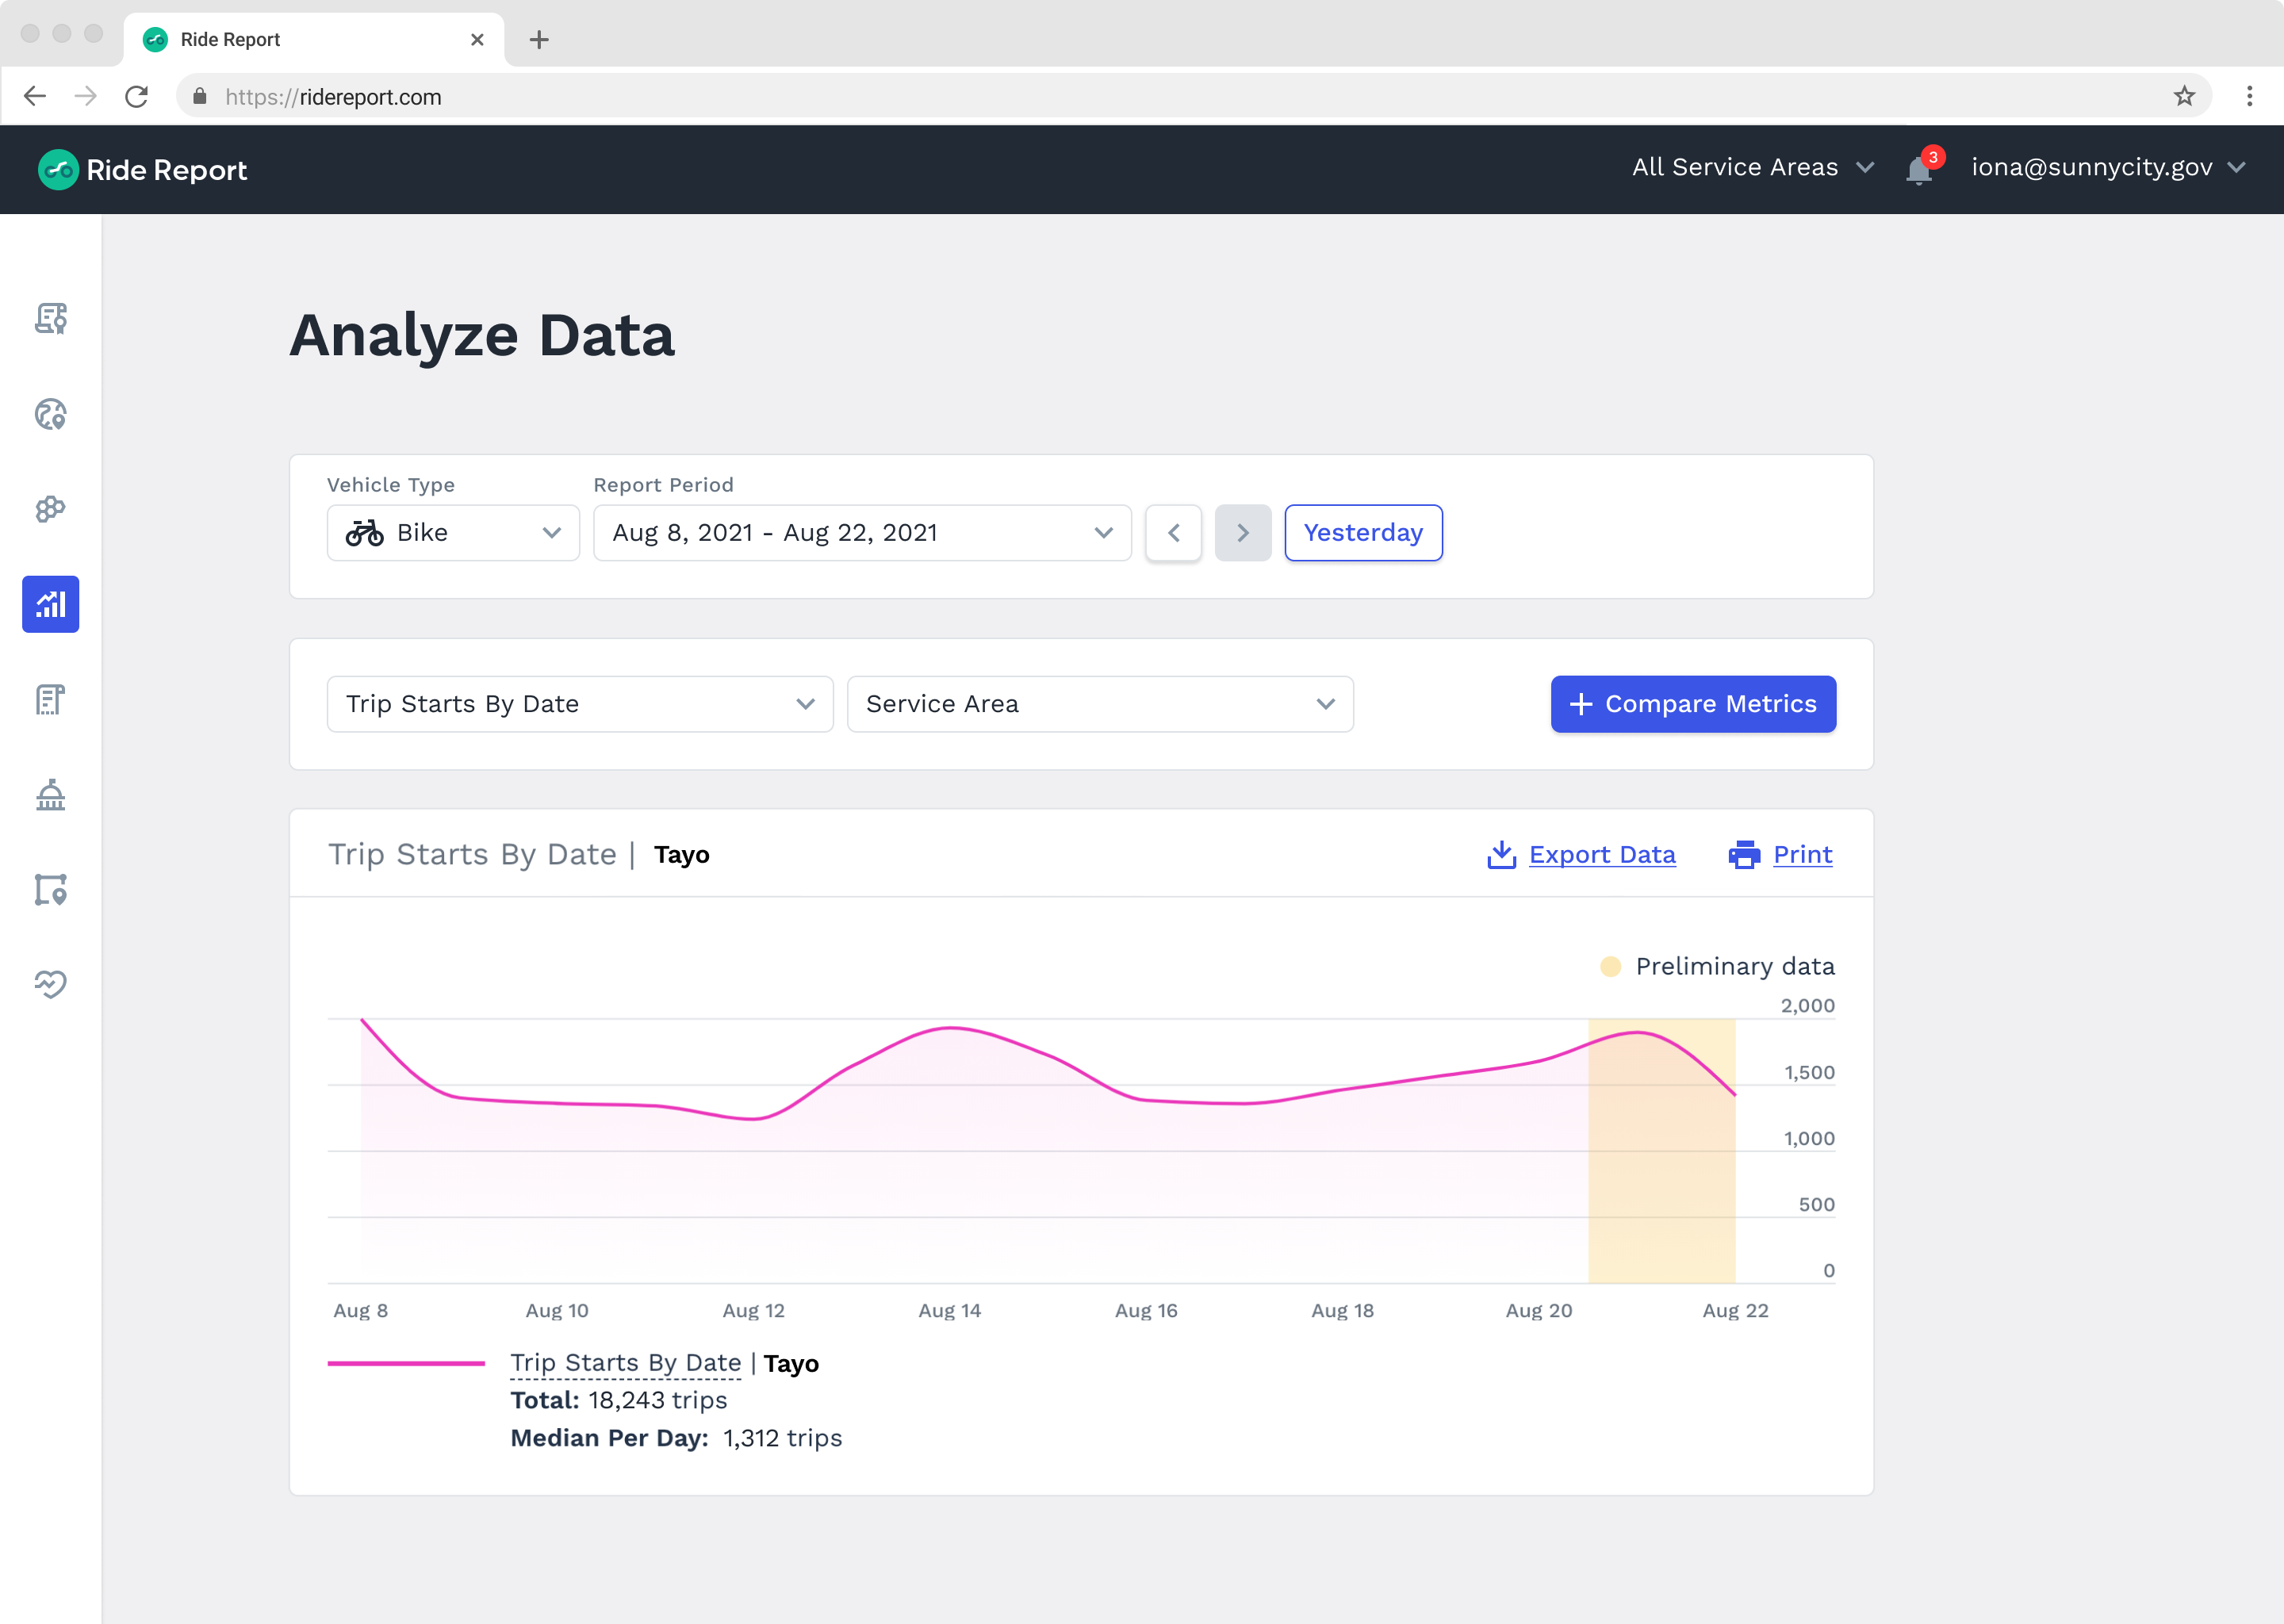
Analyze
With Ride Report’s Analyze view, city staff and project partners can view presentation-ready graphs and charts for a variety of metrics including trips per day, trip duration, trip distance, trips per hour, trips per vehicle per day, and average vehicle idle time. All features are filterable by operator and/or area of interest over the course of a given day or set of days.
Open Data Portal
Ride Report is proud to have the industry’s first and only shared mobility Open Data Portal, enabling more engagement and transparency with community stakeholders, researchers, funders, and advocacy groups. Open Data Portals provide the public with a route heatmap, overall ridership trends, specific street segment insights, and key trip data. Check it out!
Impacts
Measure and share multi-modal outcomes of new infrastructure, events, and policies, effortlessly. You set the parameters. Impacts provides the ongoing data collection, analysis, and visualization – no staff time required!
Use Rideshed™ to demonstrate the reach of your facility by visualizing which streets are most commonly used for trips that travel to, from, or through the project area or street segment.


Customer and policy support
The Ride Report team is composed of professionals from diverse backgrounds in software engineering, city and regional planning, and bicycle and pedestrian advocacy. Ride Report actively maintains our software to the highest standard and we perform frequent updates to our product to ensure that the software is up-to-date and able to meet the ever-changing industry needs. We also hold regular customer calls to provide program advice and perform custom reporting.
![]()